After an extended period of sideways consolidation, Bitcoin witnessed a downtrend, breaking below the significant support zone of $59K.
However, a notable bullish rebound near the 100-day MA suggests the potential for a resurgence in buying pressure.
Technical Analysis
By Shayan
The Daily Chart
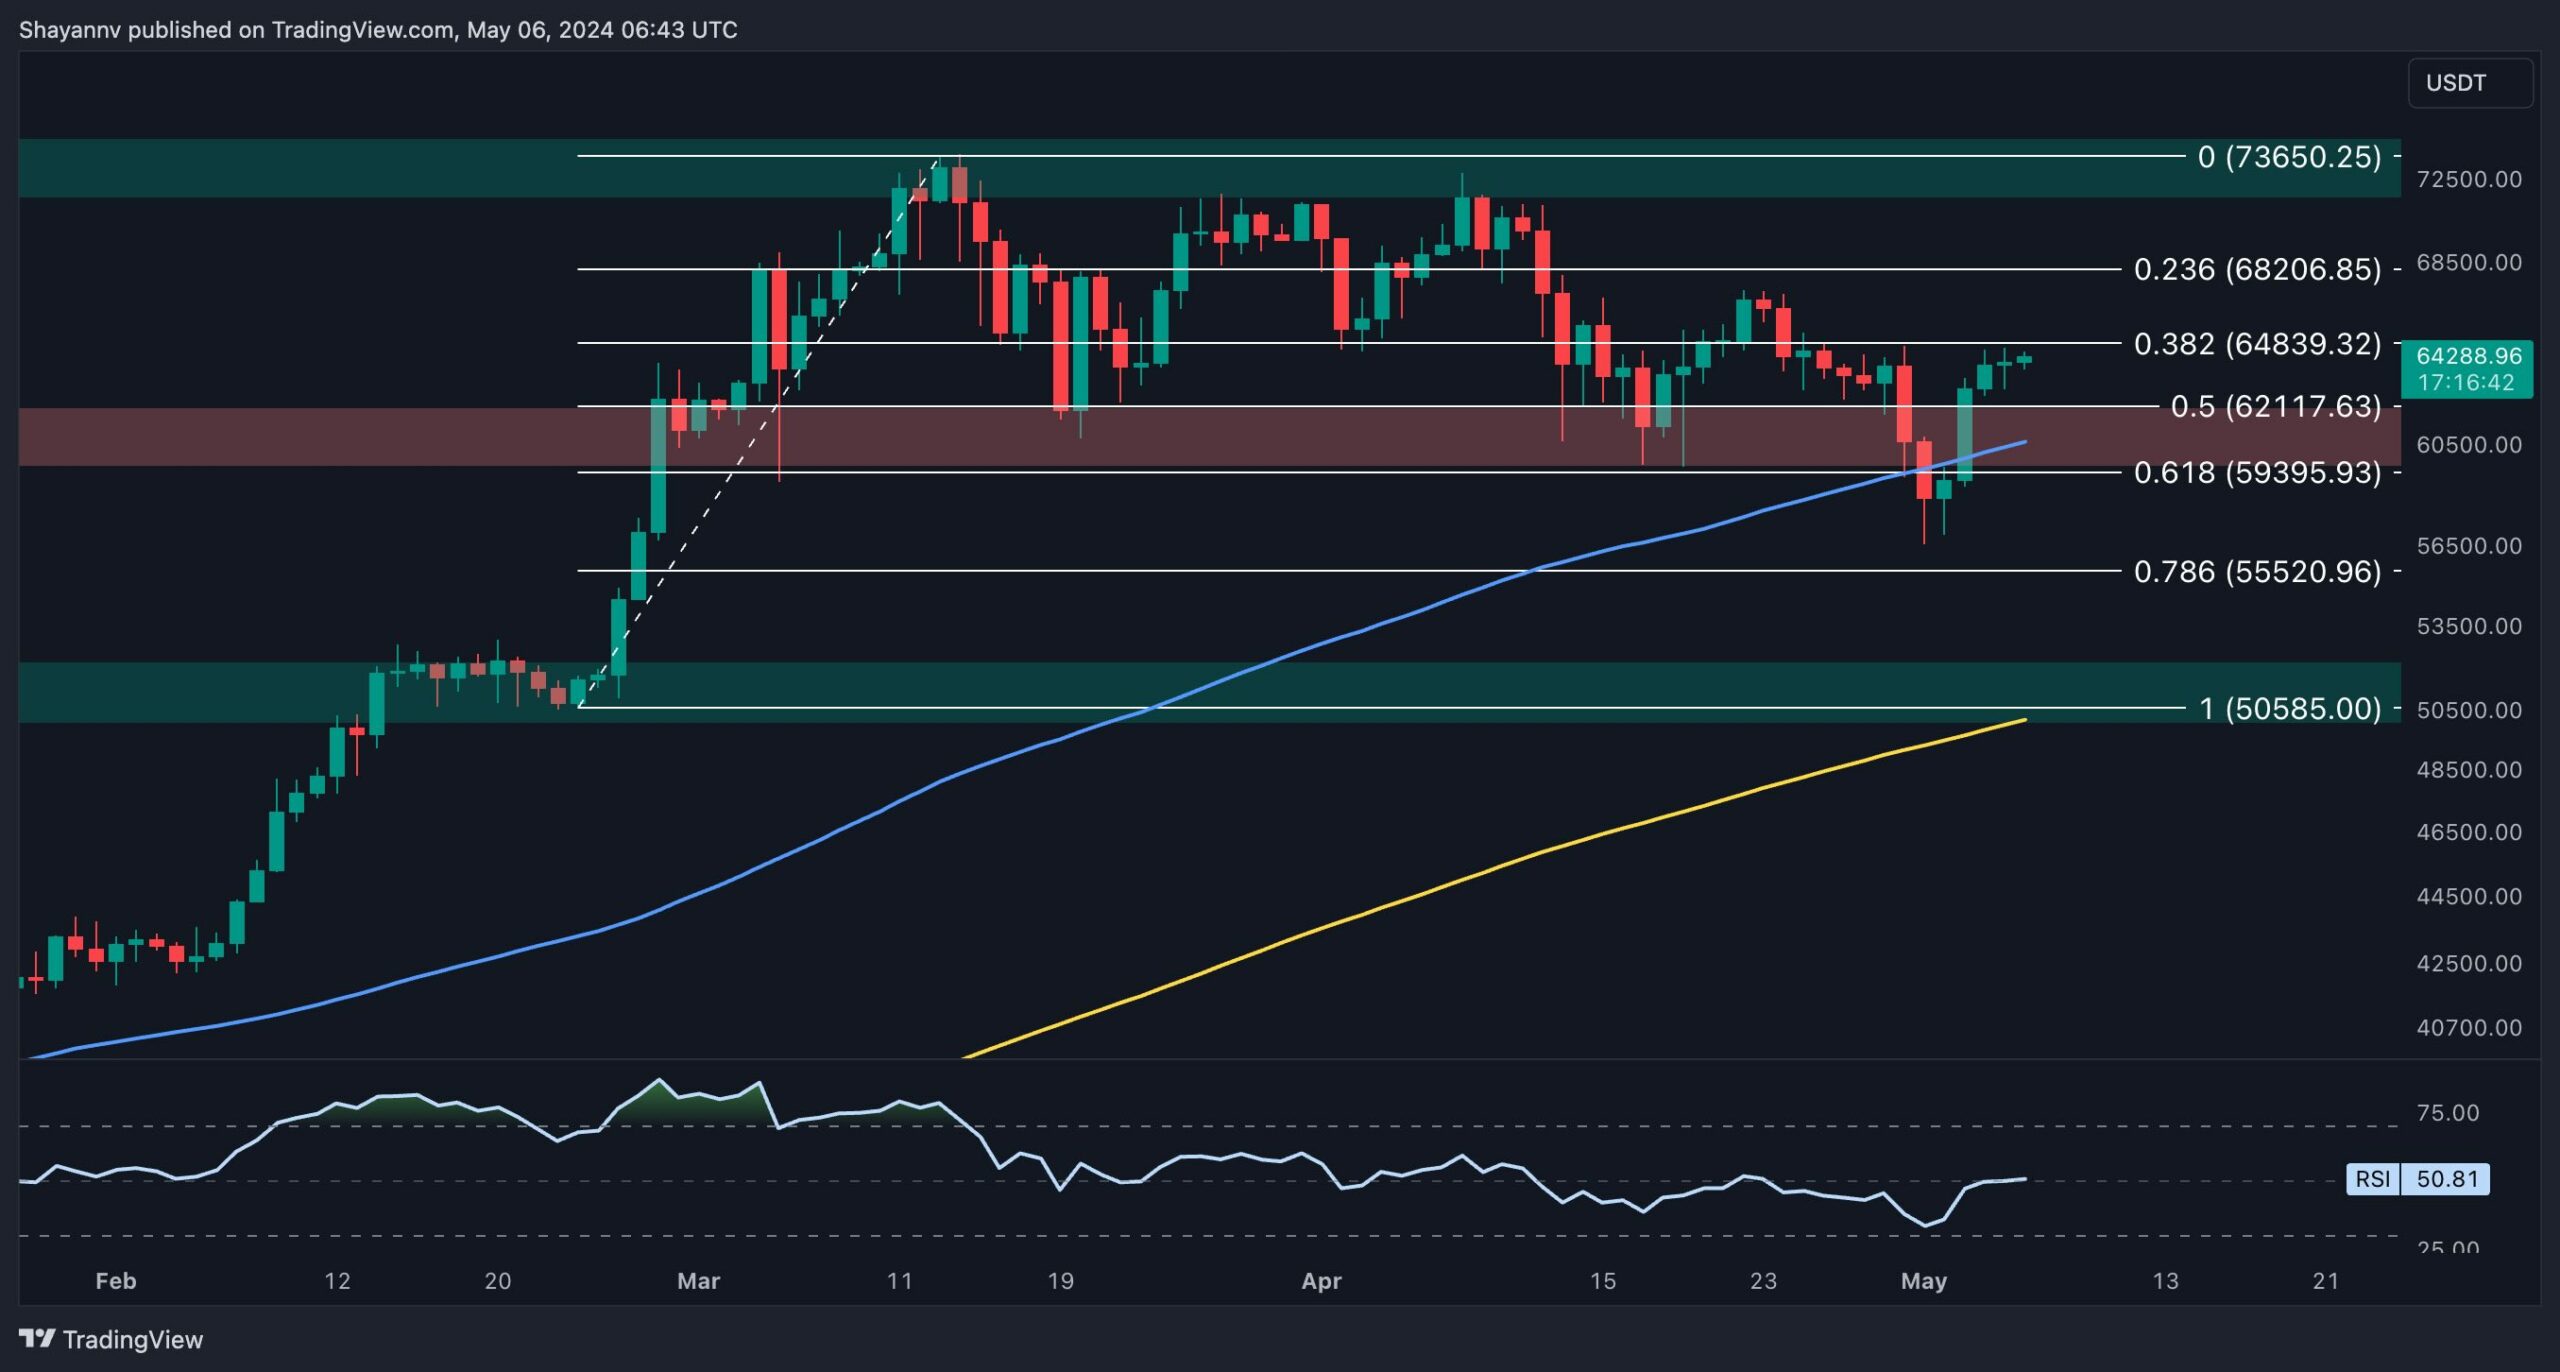
Upon a comprehensive review of the daily chart, it becomes evident that Bitcoin underwent an extended phase of sideways consolidation within the pivotal price range of $59K to $72K.
The recent price action saw a decline, breaching the lower boundary of this range and the 100-day moving average. This bearish movement resulted in the liquidation of many long positions, leading to a cooling-down period in the perpetual markets.
Nevertheless, Bitcoin found significant support at a crucial zone, the 0.618 ($59,395) Fibonacci retracement level, aligned with the vital 100-day moving average at $59K. This region sparked a bullish reversal, raising expectations for a renewed positive trend in the mid-term.
However, a sudden breach below the critical $59K level could trigger another notable downward movement toward the $56K threshold.
The 4-Hour Chart
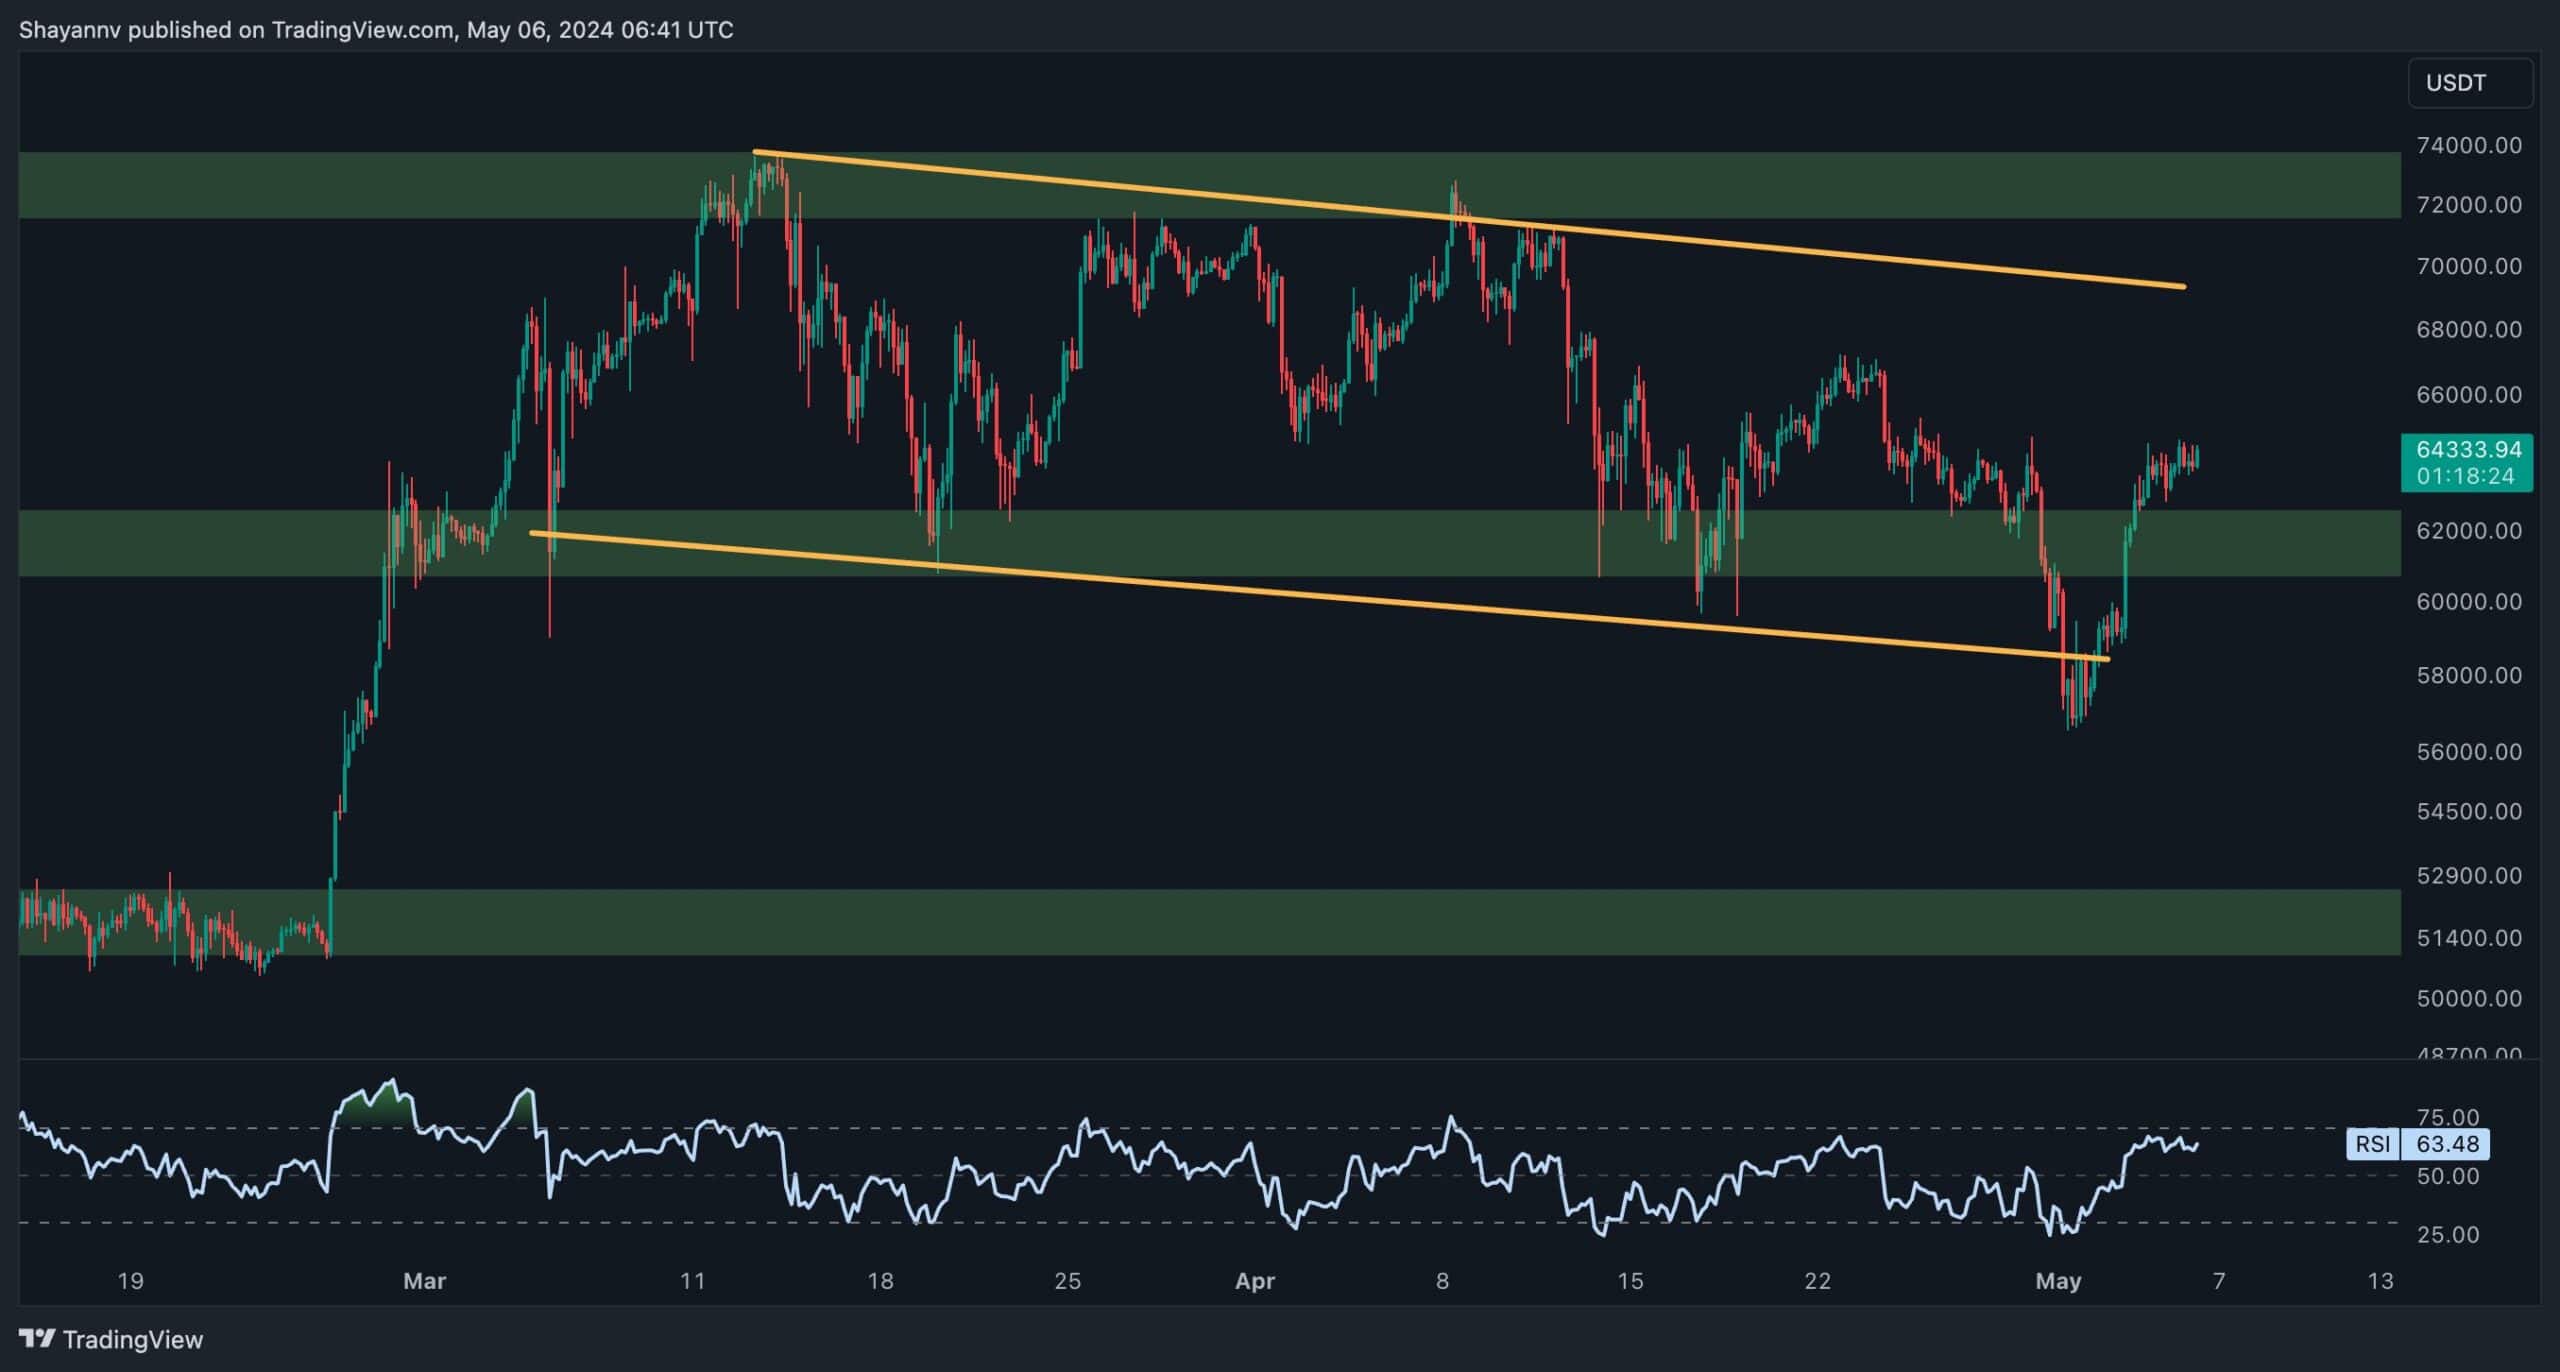
Analyzing the 4-hour chart reveals heightened selling pressure after Bitcoin failed to surpass the $68K threshold. This led to a noticeable downtrend, breaking below the lower trendline of the wedge, hovering around $59K.
Following this breach, numerous long positions were liquidated, resulting in a significant plummet and a quick test of the $56K level. However, the price swiftly rebounded, retracing above the wedge’s lower boundary and the $59K support region.
Currently, BTC is on the brink of reclaiming its previous daily swing high of $65K. If successful, the bullish trend towards the $68K mark is likely to continue in the short term.
On-chain Analysis
By Shayan
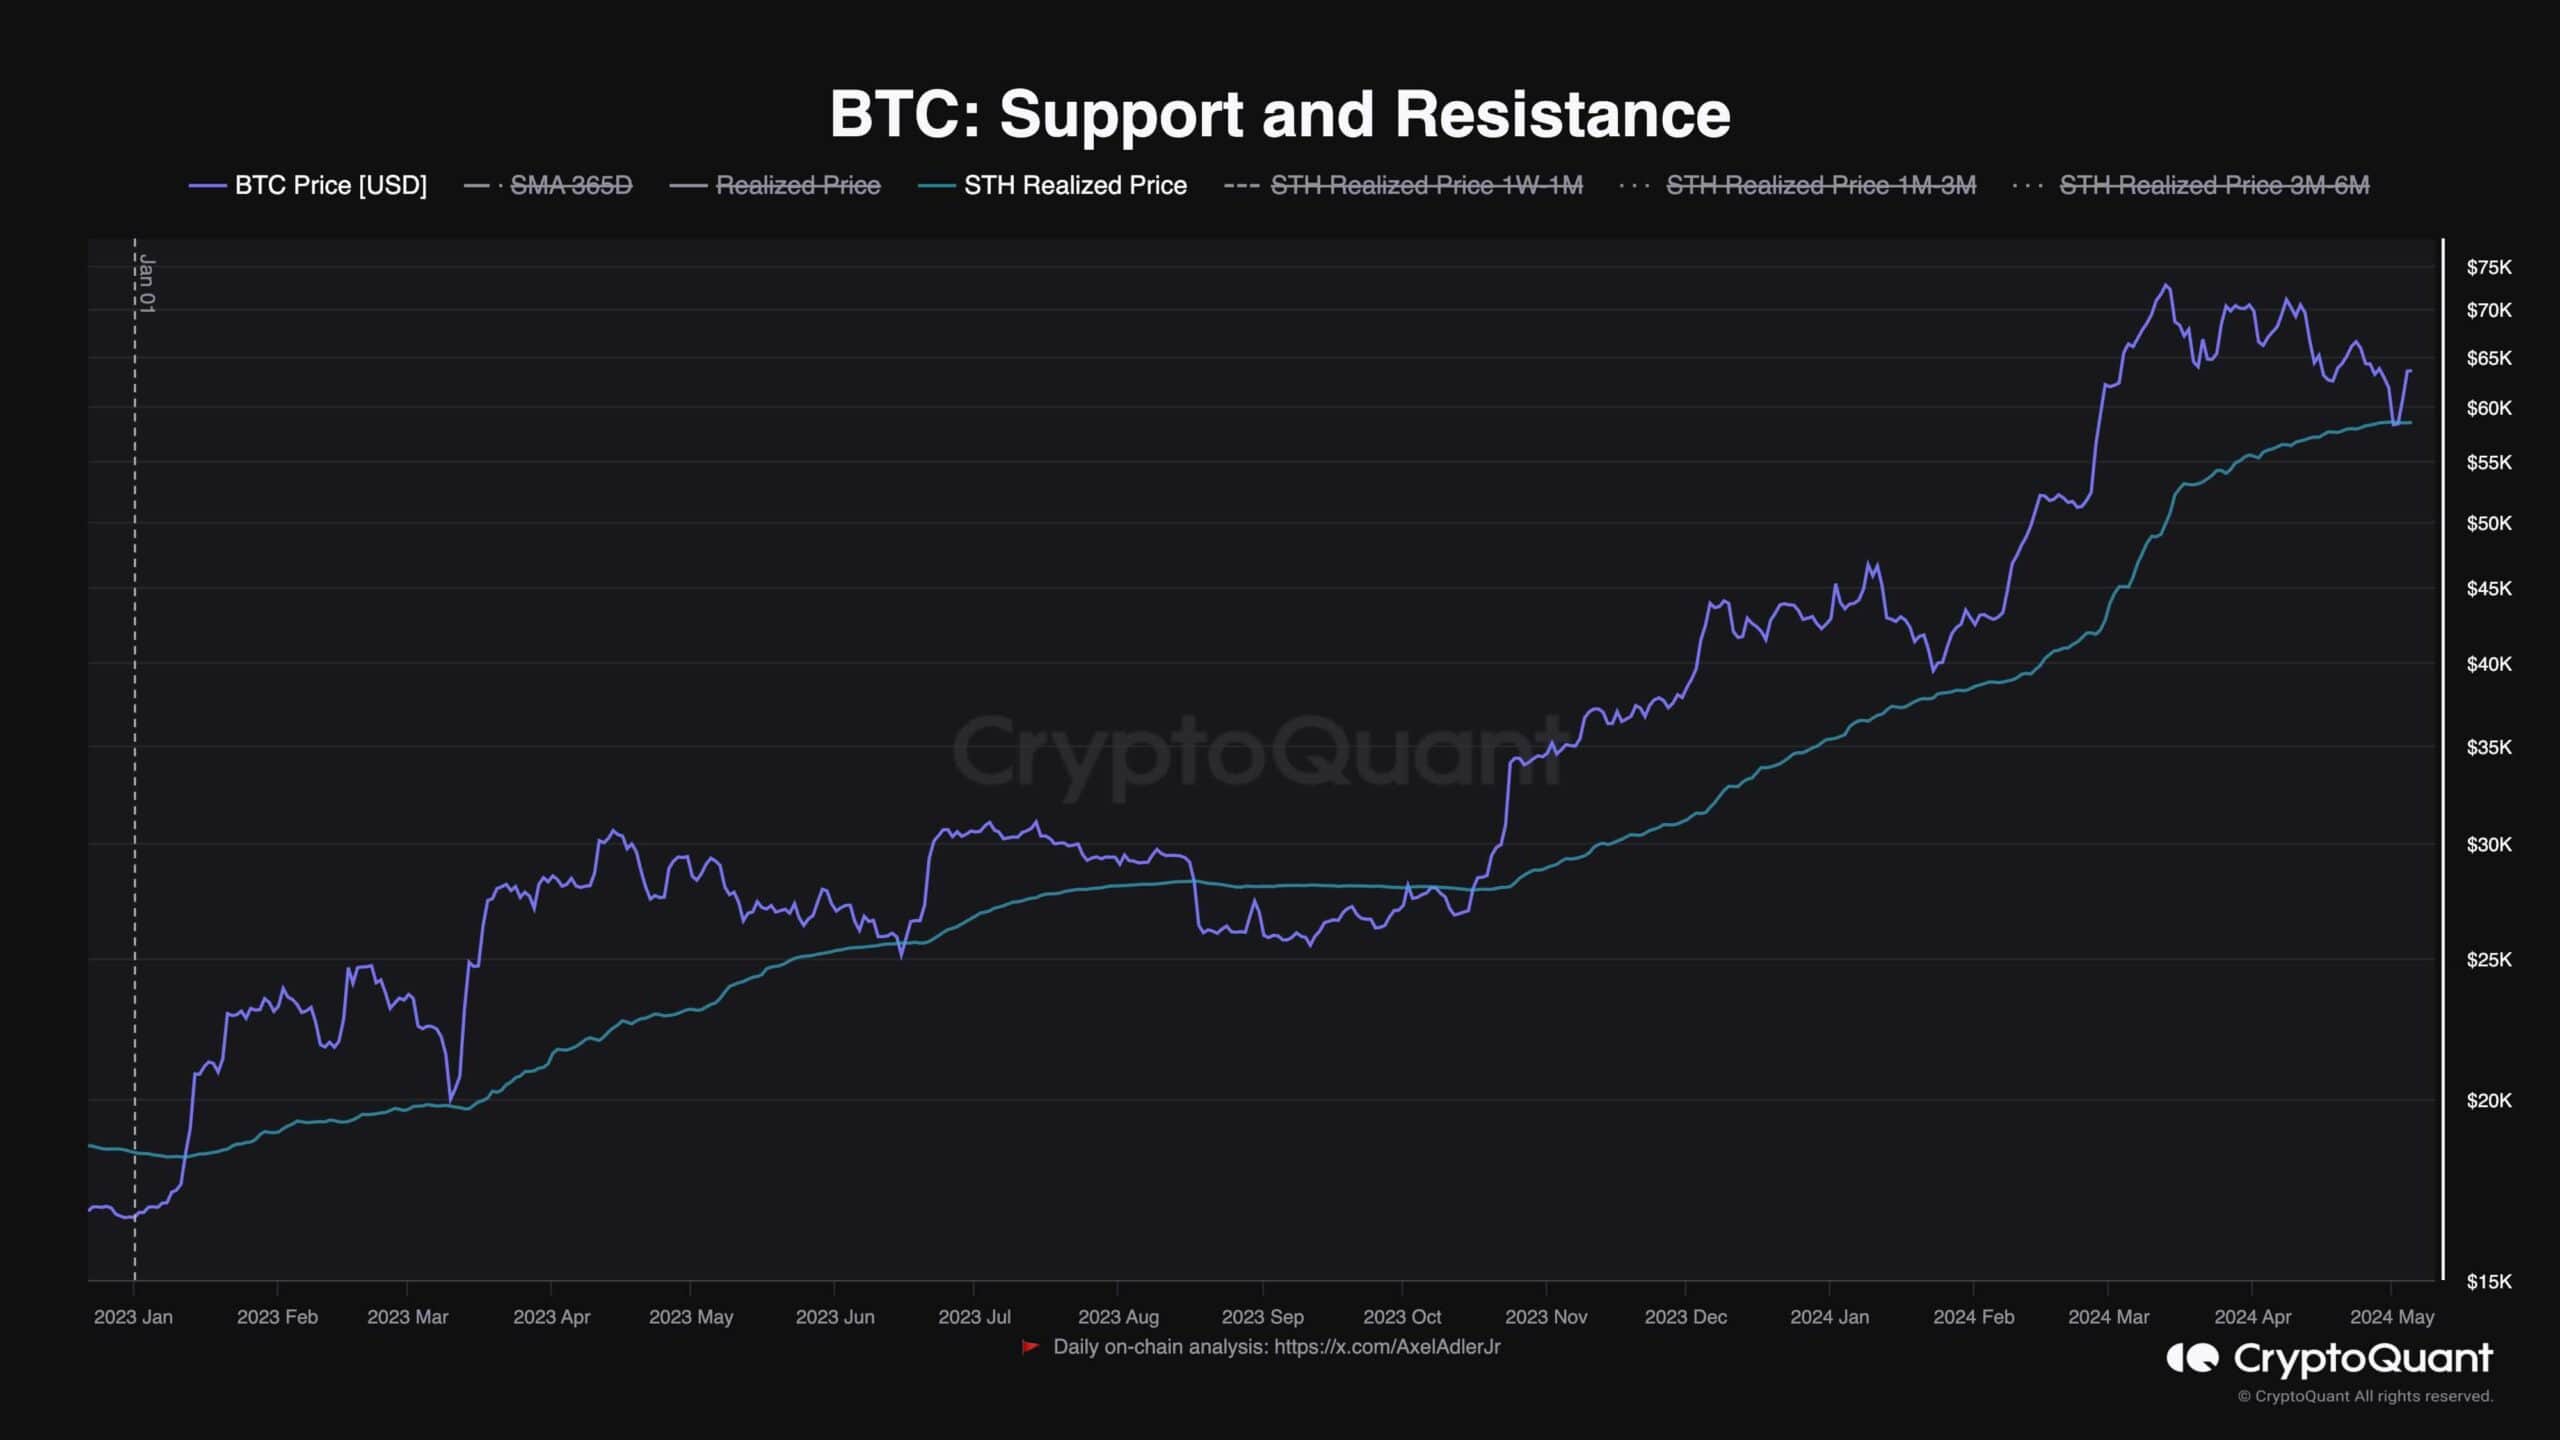
The accompanying chart showcases the Bitcoin Short-Term Holder (STH) Realized Price metric, a crucial indicator often utilized to identify support and resistance regions in the chart.
This metric calculates the average short-term realized price, encompassing transactions occurring within a span of less than 155 days. It is derived by dividing the realized cap by the total coin supply, providing a weighted average price based on what short-term holders paid for their coins.
During the bullish run, this metric has consistently served as robust support for the price on multiple occasions. Following the recent decline in Bitcoin, the price reached this pivotal level and found support, triggering a bullish rebound. However, it’s imperative to note that should the price breach below this critical dynamic support, the market could potentially experience a significant downturn.
Nevertheless, the overall trend remains bullish as long as the price remains above the short-term participants’ realized price. This metric continues to be a key factor in assessing market dynamics and anticipating potential price movements in the short term.
The post Bitcoin Bull Market Resumed or is the Push to $65K a Trap? (BTC Price Analysis) appeared first on CryptoPotato.