TL;DR
- Ethereum (ETH) surged over 20% this week, nearing $4,000, driven by hopes of SEC approval for spot ETH ETFs. Nonetheless, the official green light led to significant market volatility and a price drop.
- Analysts are divided on ETH’s future, with some predicting a major price increase and others expecting short-term corrections. Key indicators hint at a potential incoming rally.
ETH’s Next Potential Move
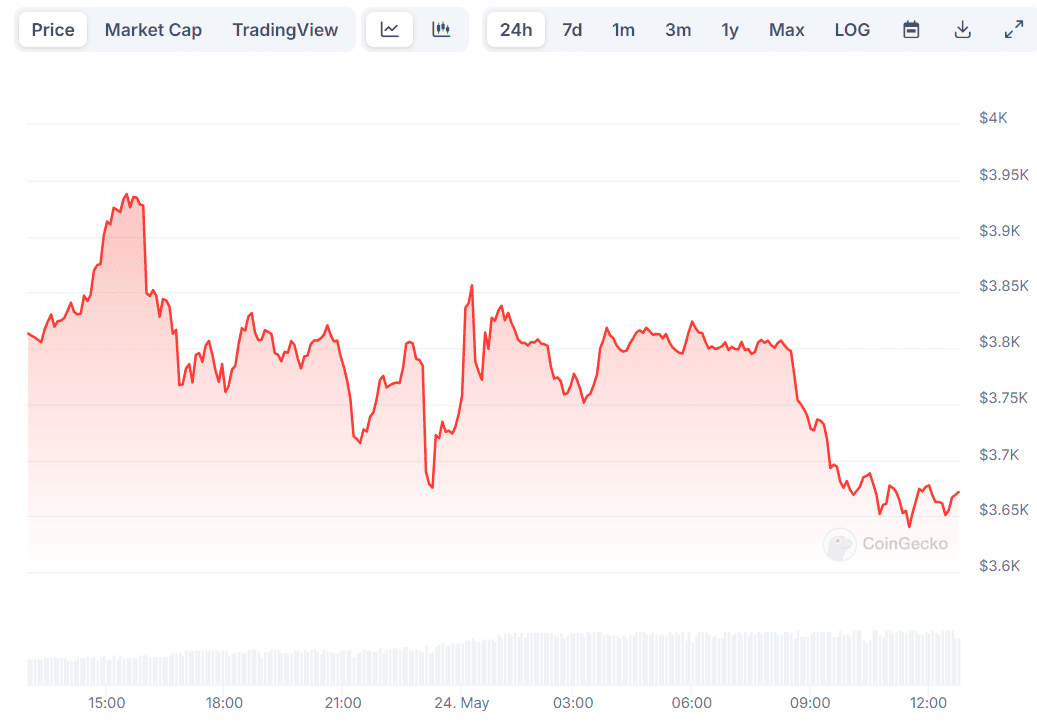
Ethereum (ETH) has been among the best-performing cryptocurrencies in the past week, with its price surging by over 20% and briefly nearing the $4,000 mark. Its rally was triggered by the reemerged hopes that the US Securities and Exchange Commission (SEC) had changed its tune on whether to approve or deny the ETF applications.
The greenlight became official several hours ago, but instead of an additional price boost, it propelled massive volatility in the entire cryptocurrency sector, with ETH entering red territory.
It is worth mentioning that the market reacted quite similarly in January this year when the American securities regulator gave its thumbs up on spot BTC ETFs.
Several analysts gave their two cents on the hot topic, with most describing the move as a major bullish factor for the entire cryptocurrency industry. One person sharing that thesis is the popular investor and entrepreneur Anthony Pompliano.
The X user CryptoYoddha chipped in, too, claiming that “Ethereum doesn’t care if they approve the ETFs or not.” The analyst provided a chart according to which the asset’s value is projected to surpass the $13K mark sometime next year, assuming this will coincide with the bull cycle’s top.
However, not all are that optimistic. Ali Martinez touched upon the matter shortly before the SEC’s green light, suggesting that the TD Sequential “presents a sell signal on Ethereum’s daily chart.” As such, he anticipates “a one to four daily candlesticks correction for ETH.”
TD Sequential is an important indicator developed by Tom DeMark. It is used to identify potential points of trend exhaustion and reversal in financial and crypto markets. It is based on consecutive bars closing higher or lower.
What Are Other Metrics Signaling?
A major element that could give a hint about ETH’s next price movement is open interest. The indicator refers to the total number of outstanding derivative contracts, such as futures or options, that have not been settled for Ethereum and is used to gauge the market’s sentiment.
Recently, the metric hit an all-time high, suggesting that significant price swings in both directions could be on the horizon.
Another indicator worth observing is Ethereum’s exchange netflow, which has been negative in the past two days. Such a shift from centralized platforms to self-custody methods is considered bullish since it reduces the immediate selling pressure.
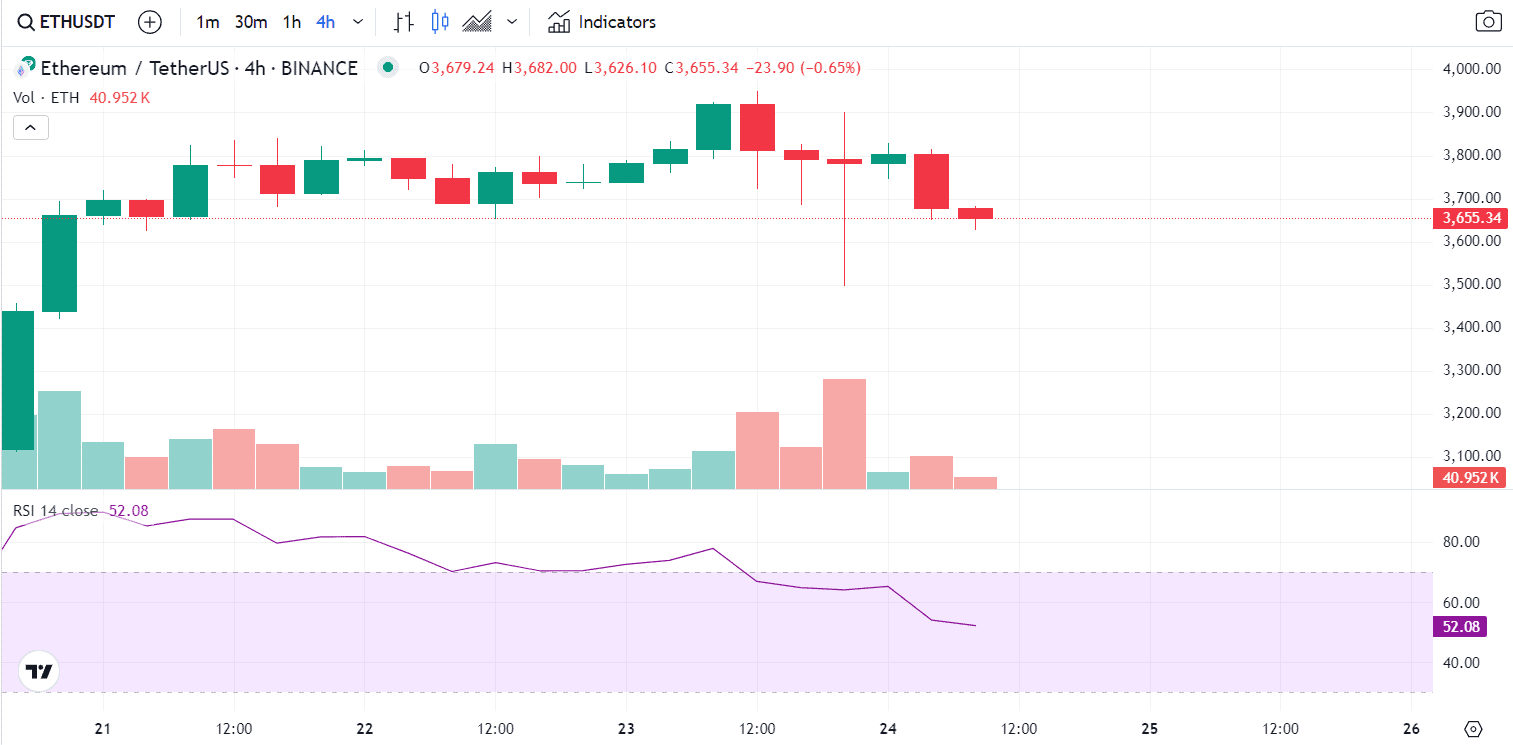
Last but not least, we will touch upon the Relative Strength Index (RSI) applied to ETH. The indicator measures the speed and change of price movements and ranges from 0 to 100. A ratio above 70 signals that the asset may be overbought and could be due for a correction. Latest data shows that RSI stands at around 52.
The post Bull Run or Major Correction for Ethereum (ETH) After the ETF Approvals? Analysts Chip in appeared first on CryptoPotato.