Bitcoin’s notable rally is now approaching a major technical decision point. The asset has reclaimed several short-term resistance levels and is once again testing a critical supply area that could determine whether the current recovery evolves into a broader trend reversal or remains a relief rally within the larger bearish structure.
Bitcoin Price Analysis: The Daily Chart
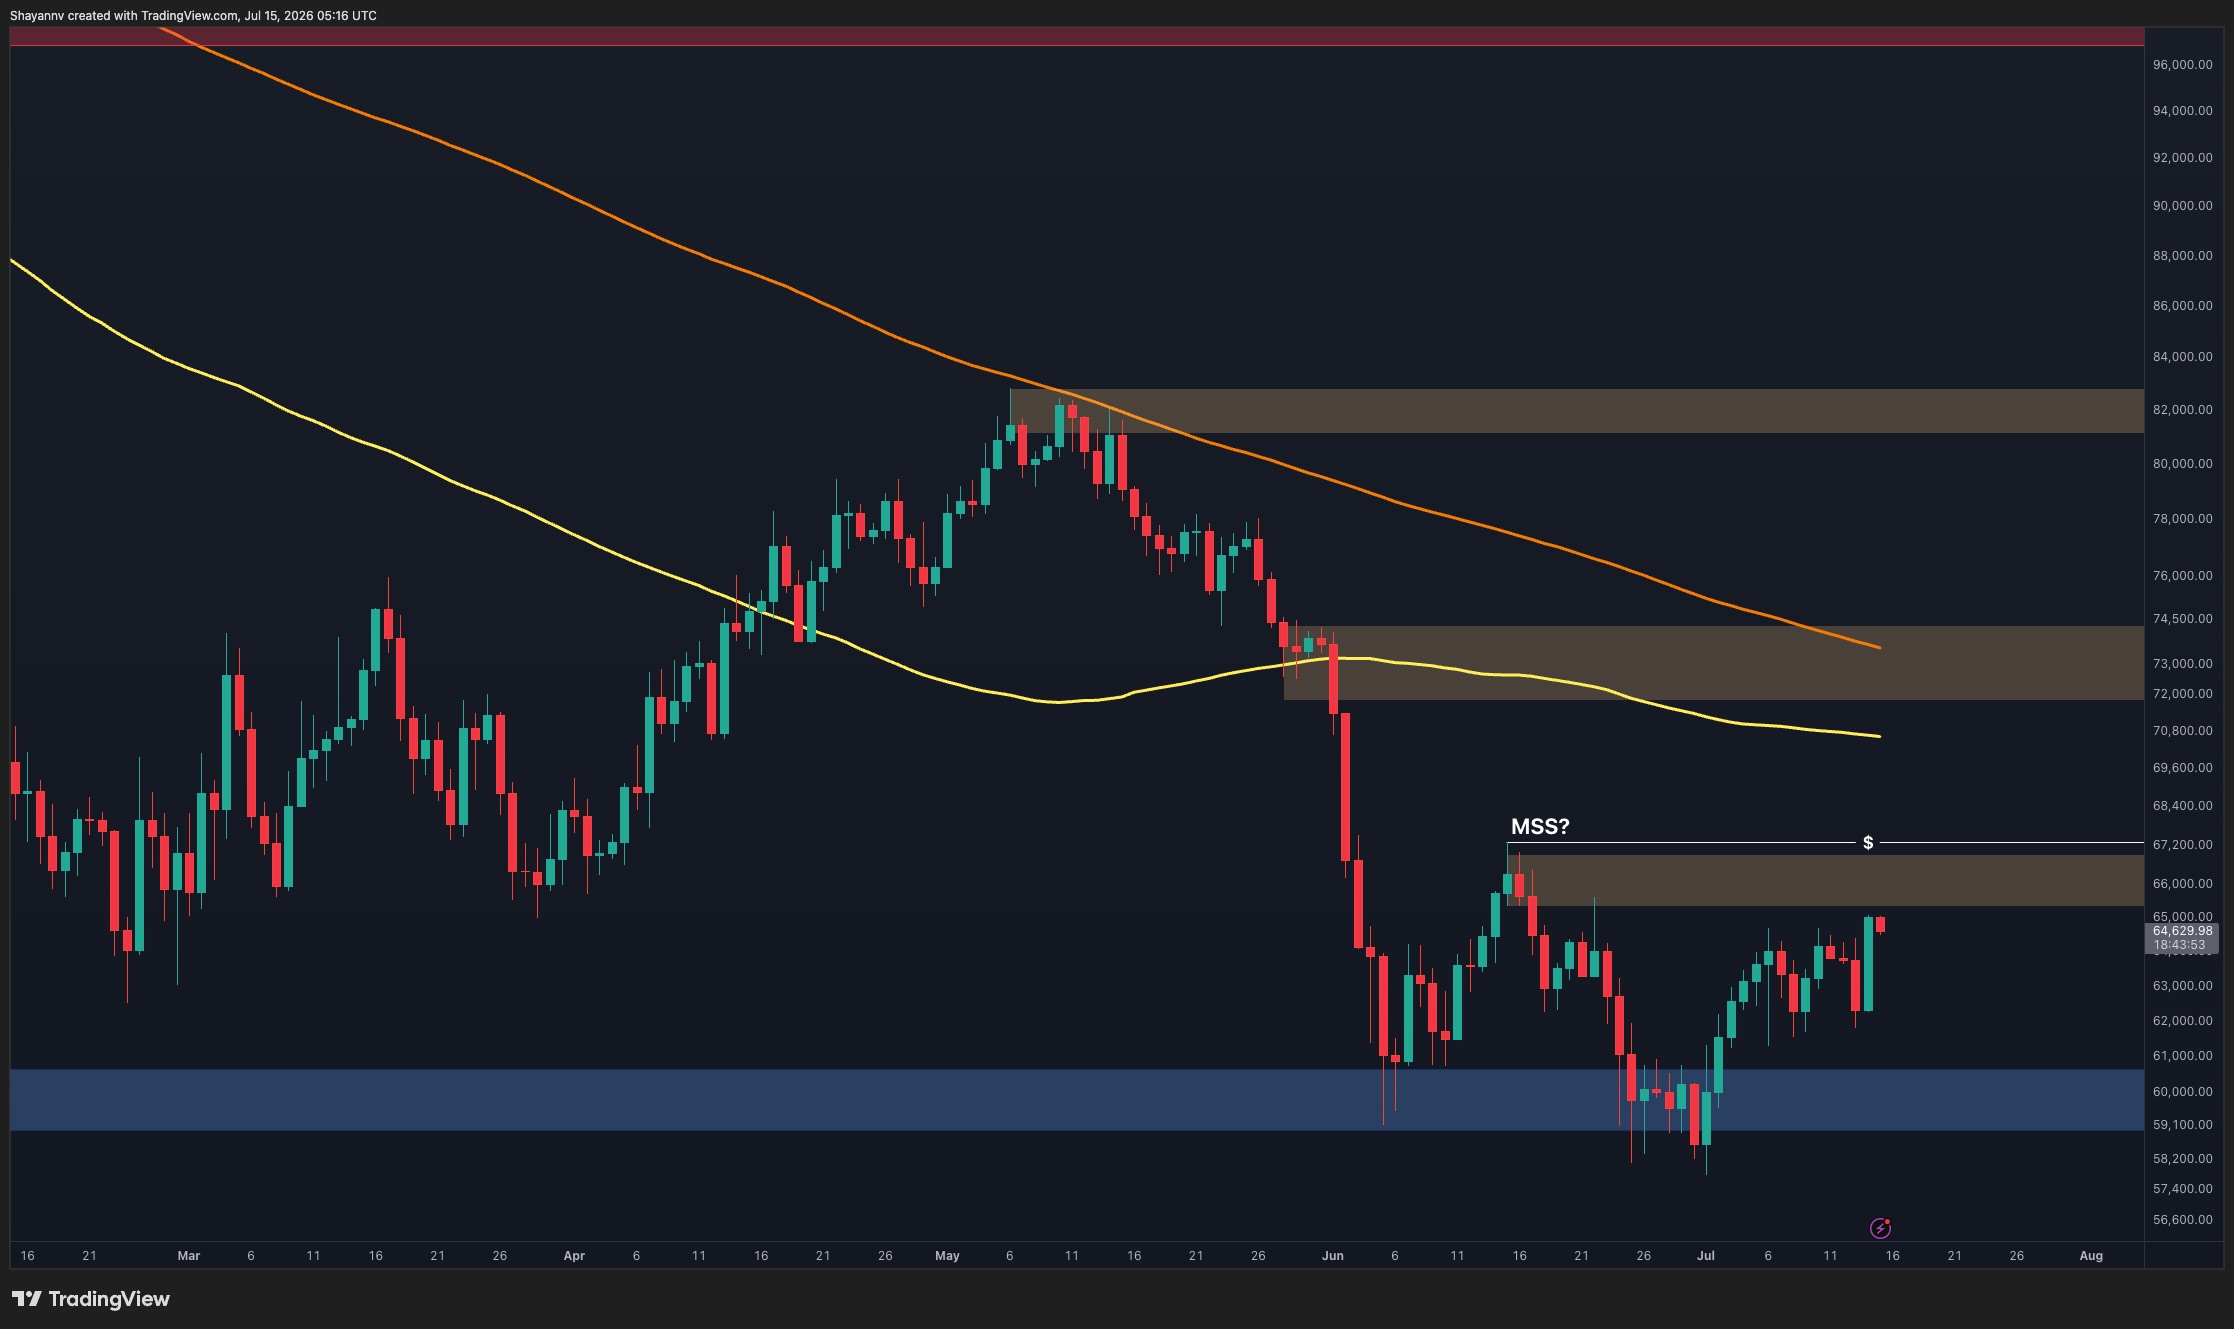
On the daily timeframe, Bitcoin remains below both the 100-day and 200-day moving averages, which continue to slope downward and reinforce the broader bearish trend. The recent recovery from the $58K-$60K support zone has been impressive, but the price is now approaching the first significant supply region around $65K-$67K.
This area is particularly important because it coincides with a previous major swing high and a liquidity pool resting above recent highs. A successful breakout above this region marks an MSS and would strengthen the bullish case and expose the next major resistance around $72K-$74K, where the 100-day moving average is currently positioned.
Despite the recovery, the broader market structure remains bearish while Bitcoin trades below the descending moving averages and the major resistance zones overhead. Therefore, the $65K-$67K region remains the key level to monitor in the coming sessions.
BTC/USDT 4-Hour Chart
The 4-hour chart shows a much more constructive picture. BTC has continued to print higher lows since the early July bottom and has successfully defended the $61K-$62K support zone multiple times.
The price is currently testing the upper boundary of a descending wedge structure while simultaneously challenging the supply zone around $65K-$66K. The market has already swept the intra-range liquidity resting above the $61K-$62K support area before accelerating higher toward resistance.
The recent impulsive move suggests buyers remain in control in the short term. However, Bitcoin is now approaching the convergence of the wedge resistance and the higher-timeframe supply zone. This creates a logical area where profit-taking and renewed selling pressure could emerge.
A confirmed breakout above the wedge and the $65K-$66K resistance area would likely trigger a continuation toward $72K-$74K. Conversely, rejection from this zone could lead to another retracement toward the $61K-$62K support region.

Sentiment Analysis
The Spot Average Order Size metric provides valuable insight into current market participation. The chart shows a noticeable increase in large spot transactions after a prolonged decline, suggesting larger market participants have become more active near the recent lows.
Historically, periods where large orders begin to increase after extended weakness often indicate accumulation activity from larger investors rather than aggressive retail participation. The recent uptick in average order size coincides with Bitcoin’s recovery from the $58K-$60K region, supporting the idea that stronger hands may be stepping into the market.
At the same time, the metric remains well below the levels seen during previous major bullish phases, indicating that institutional conviction has not yet fully returned. This suggests the current recovery is improving structurally, but confirmation through higher highs and a breakout above key resistance levels is still required.
Overall, Bitcoin is approaching a pivotal resistance zone between $65K and $67K. A successful breakout would strengthen the bullish recovery narrative and open the path toward $72K-$74K. However, failure to reclaim this region could result in another period of consolidation or a pullback toward lower support levels before the market attempts a larger trend reversal.

The post Bitcoin Price Analysis: BTC Pushes Past $65K – Can It Keep Climbing? appeared first on CryptoPotato.