

Ethereum has extended its recovery over the past few weeks, but the rally is now approaching a technically sensitive area. While the recent strength has improved short-term sentiment, the higher-timeframe structure has yet to confirm a sustained trend reversal, leaving room for increased volatility around current levels.
Ethereum Price Analysis: The Daily Chart
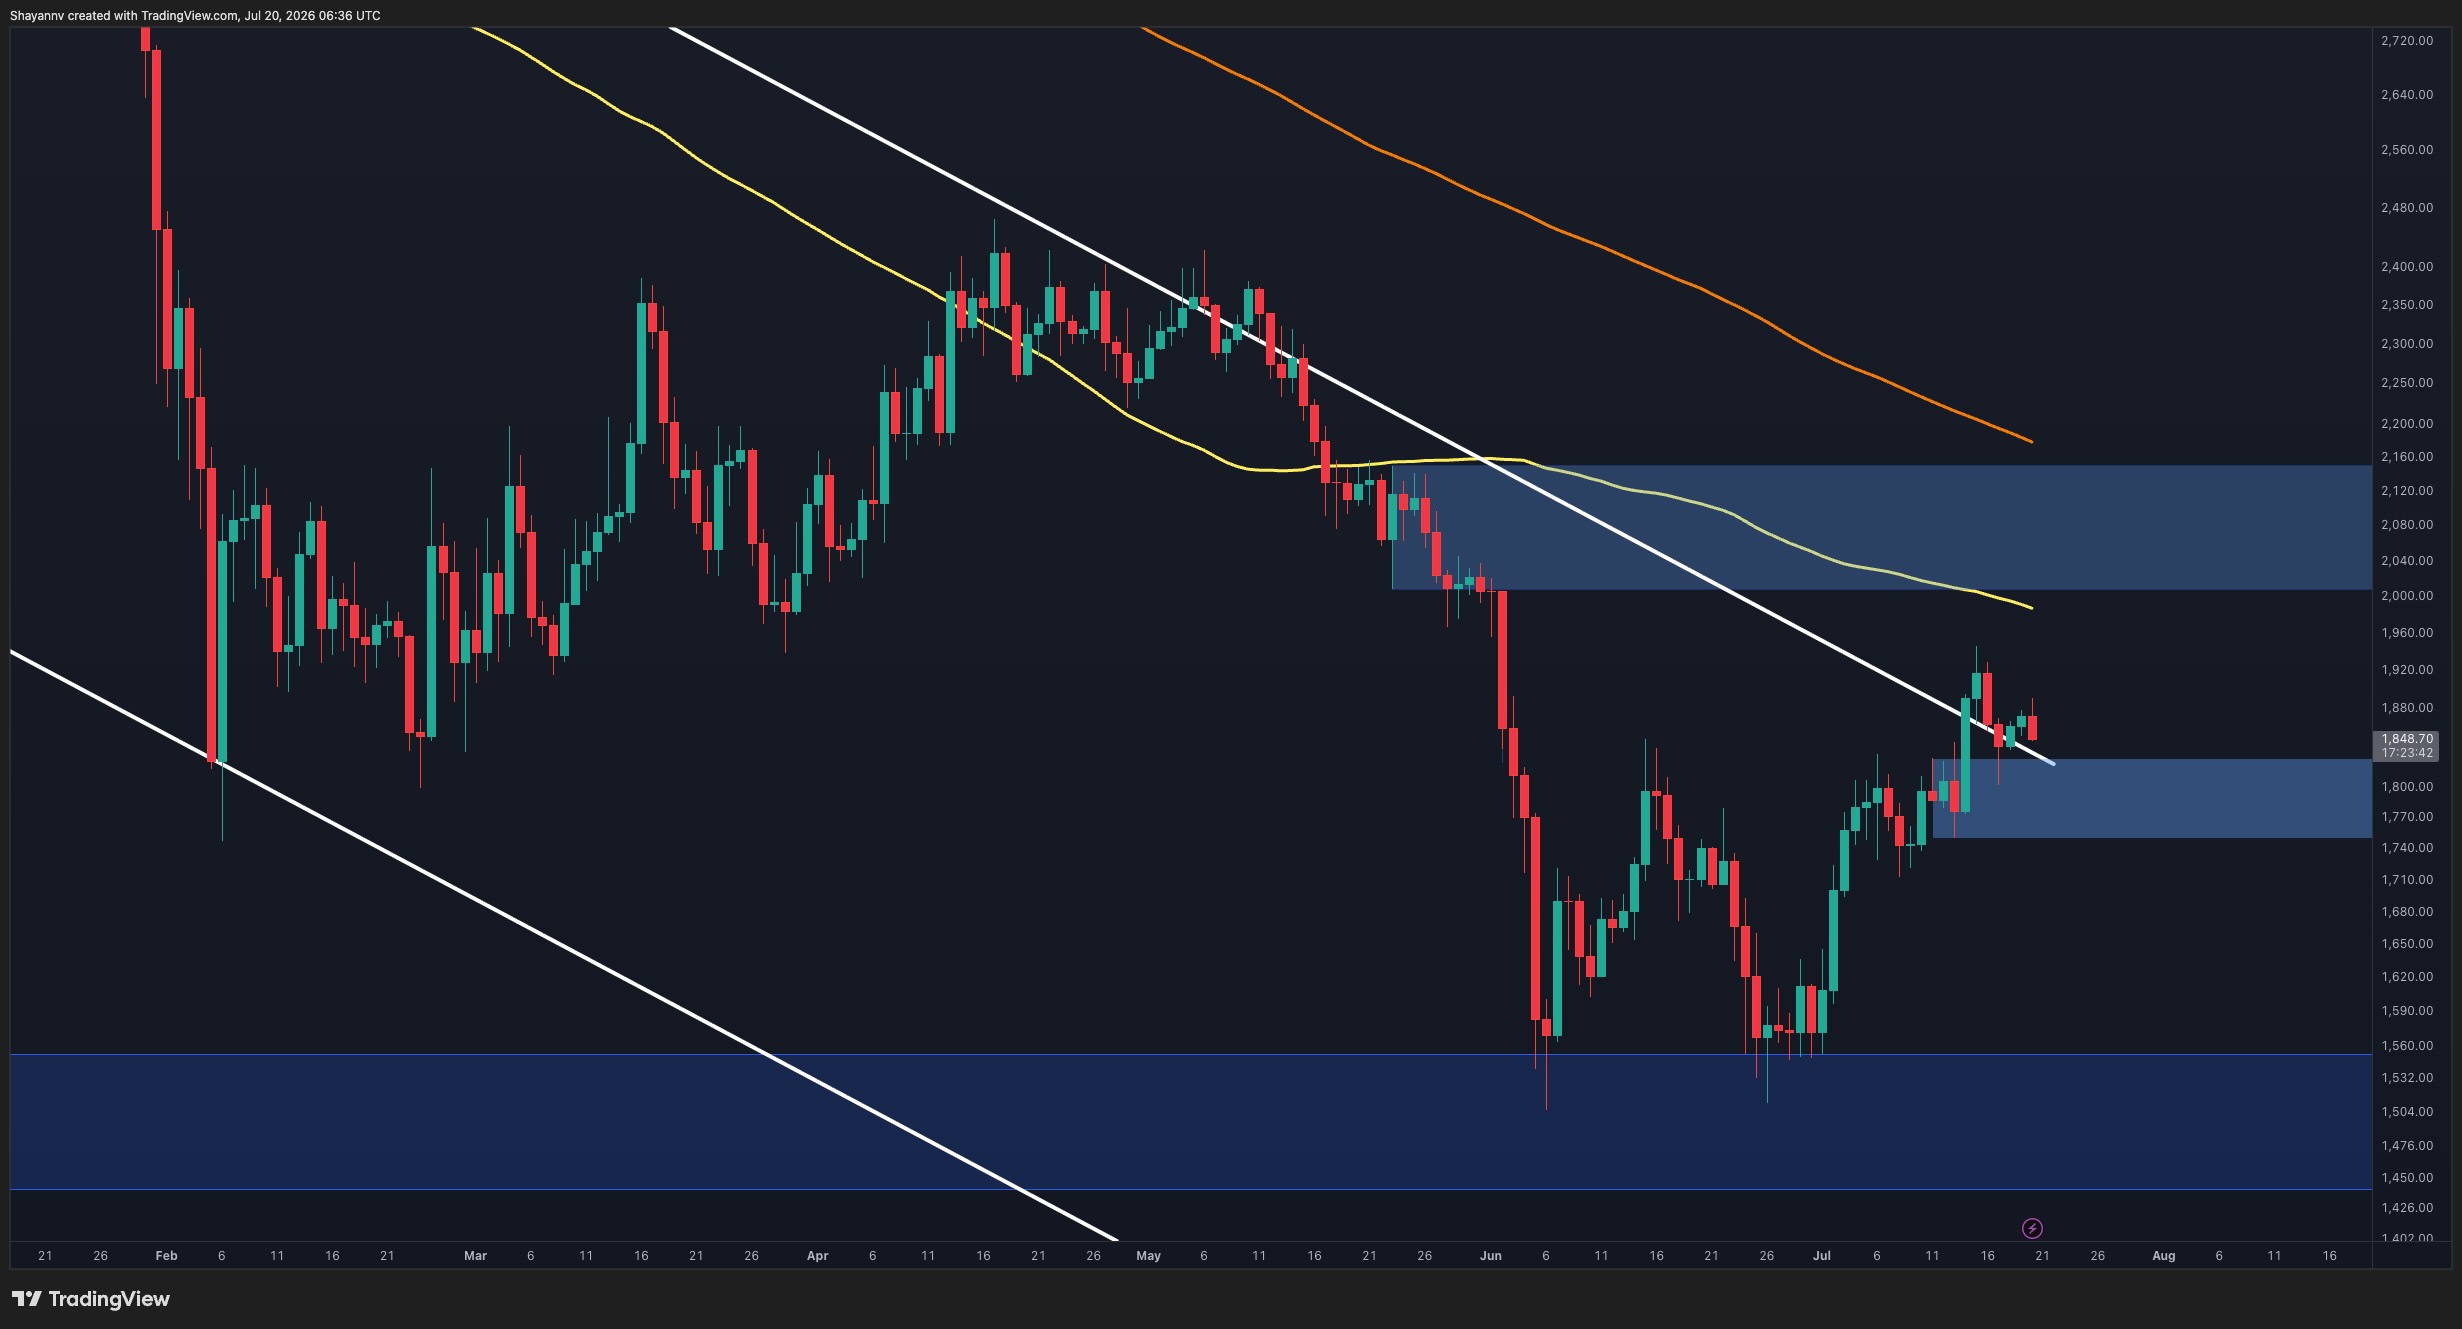
On the daily timeframe, ETH has broken above the upper boundary of the descending channel that guided the broader downtrend for several months. While this initially appears constructive, the breakout has not yet been confirmed and could still develop into a false breakout if price fails to hold above the former channel resistance over the coming sessions.
The $2K-$2.15K supply zone remains the primary obstacle for bulls. This area is reinforced by the declining 100-day moving average, making it a significant resistance cluster despite the recent improvement in price action.
On the downside, the $1.75K-$1.8K region now acts as the first line of defense. Holding this zone would keep the breakout attempt intact, whereas losing it could drag ETH back toward the broader demand area around $1.5K-$1.55K and confirm that the move above the channel was merely a liquidity sweep rather than a genuine trend reversal.
ETH/USDT 4-Hour Chart
The 4-hour chart shows Ethereum consolidating within an ascending flag after the sharp impulsive rally from the July lows. Rather than signaling immediate weakness, the current pullback appears to be developing as a corrective phase inside the broader recovery.
The white ascending trendline represents the flag’s intra-dynamic support and has repeatedly attracted buyers during recent retracements. As long as ETH continues to respect this trendline, the structure favors another attempt to challenge the recent swing high around $1.9K.
However, a decisive break below the ascending support would invalidate the flag structure and expose the blue demand zone around $1.76K-$1.8K, where buyers would likely attempt to regain control.

Sentiment Analysis
The Exchange Inflow (Top 10) metric tracks the amount of ETH transferred to exchanges by the largest deposit transactions, which are often associated with whales and institutional participants.
Recent data shows that exchange inflows from large holders have remained relatively subdued following several notable spikes earlier in the year. The latest readings are well below those previous peaks despite Ethereum’s recovery toward $1.8K, suggesting there has not been a meaningful increase in selling pressure from major market participants.
This relatively muted inflow profile complements the current technical structure. While it does not guarantee further upside, the absence of aggressive exchange deposits from large holders indicates that significant profit-taking has yet to emerge, allowing Ethereum to continue testing higher resistance levels as long as the short-term support structure remains intact.

The post Ethereum Price Analysis: ETH Tests Crucial Resistance Following Channel Breakout appeared first on CryptoPotato.

